
WHY THIS REPORT MATTERS
From 2011 to 2016, the Auditor General’s Office completed a series of Continuous Controls Monitoring (CCM) projects using data analysis and reviewing overtime, absenteeism, kilometrage, telecommunication, and accounts payable, identifying $20 million in savings and resulting in noticeable improvements across the City.
The Auditor General included a CCM project in her 2026 Work Plan to support ongoing monitoring of controls for payroll-related expenses.
This report provides the results of the data analysis and highlights the City divisions with the highest levels in the areas examined.
BY THE NUMBERS
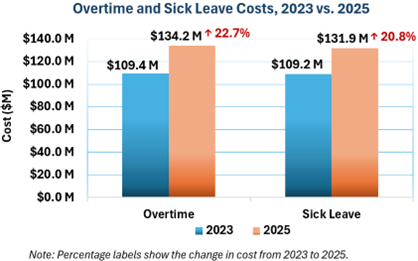
- $134.2 million in city-wide overtime costs in 2025, a 22.7% increase since 2023
- 77.5% of City-wide overtime costs in 2025 were concentrated in the top five divisions
- 362 employees earned more than 50% or $50K of their salary in overtime in 2025
- $131.9 million in short-term sick leave costs in 2025
- 57.7% of sick leave costs were concentrated in top five divisions
- 998 employees exceeded 500 sick leave hours in 2025
- $10.3 million standby pay in 2025
- $1.6 million callback costs in 2025
- $1.74 million kilometrage reimbursements in 2025
HOW RECOMMENDATIONS WILL BENEFIT THE CITY
Implementing the four recommendations in this report will help management strengthen internal controls for payroll-related expenses and may result in overall savings to the City.
WHAT WE FOUND
Our review found that all selected payroll-related expenses, including overtime and sick leave, increased from 2023 to 2025. This highlights the need for a focused review of overtime and sick leave drivers, along with division-level monitoring of the areas with the largest and fastest-growing costs.
We asked management to review the results from our data analysis, and their comments are provided in the appendices of the report with highlights below
A. Staff Overtime and Standby Usage
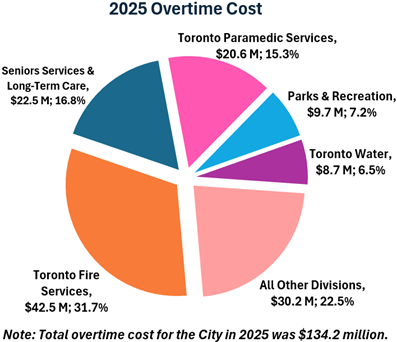
Overtime is often needed for emergency services like fire and paramedics to maintain adequate staffing and Council-directed service levels. Toronto Fire Services had the highest overtime cost in 2025; however, that cost declined moderately since 2023. Seniors Services & Long-Term Care overtime costs increased to $22.5M in 2025, a 102.7% increase from 2023, due to staffing shortages, with overtime often used to cover absences and higher vacancy rates.
B. Sick, Bereavement, and Ill-Dependent Leaves
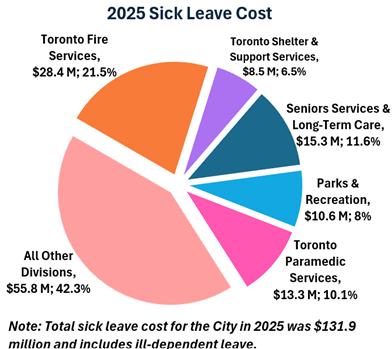
Overall absences, including sick leave costs, increased across the City. Sick time was highest in divisions providing 24/7 services in high stress areas. Toronto Fire Services remained the highest-cost division, while Parks & Recreation and Toronto Shelter and Support Services had significant cost increases of 34% and 44%, respectively.
C. Need for Strengthening Controls Over Payroll Processes and Attendance Management
In 2001, the City implemented the Attendance Management Program to monitor and address employee absenteeism. In 2025, City-wide average absenteeism was 9.48 days per employee, 18.5% above the City’s eight-day standard. Our review identified opportunities to update and strengthen the program’s effectiveness by improving oversight, centralizing tracking, and revisiting the City’s and divisional standards to better align with current needs.